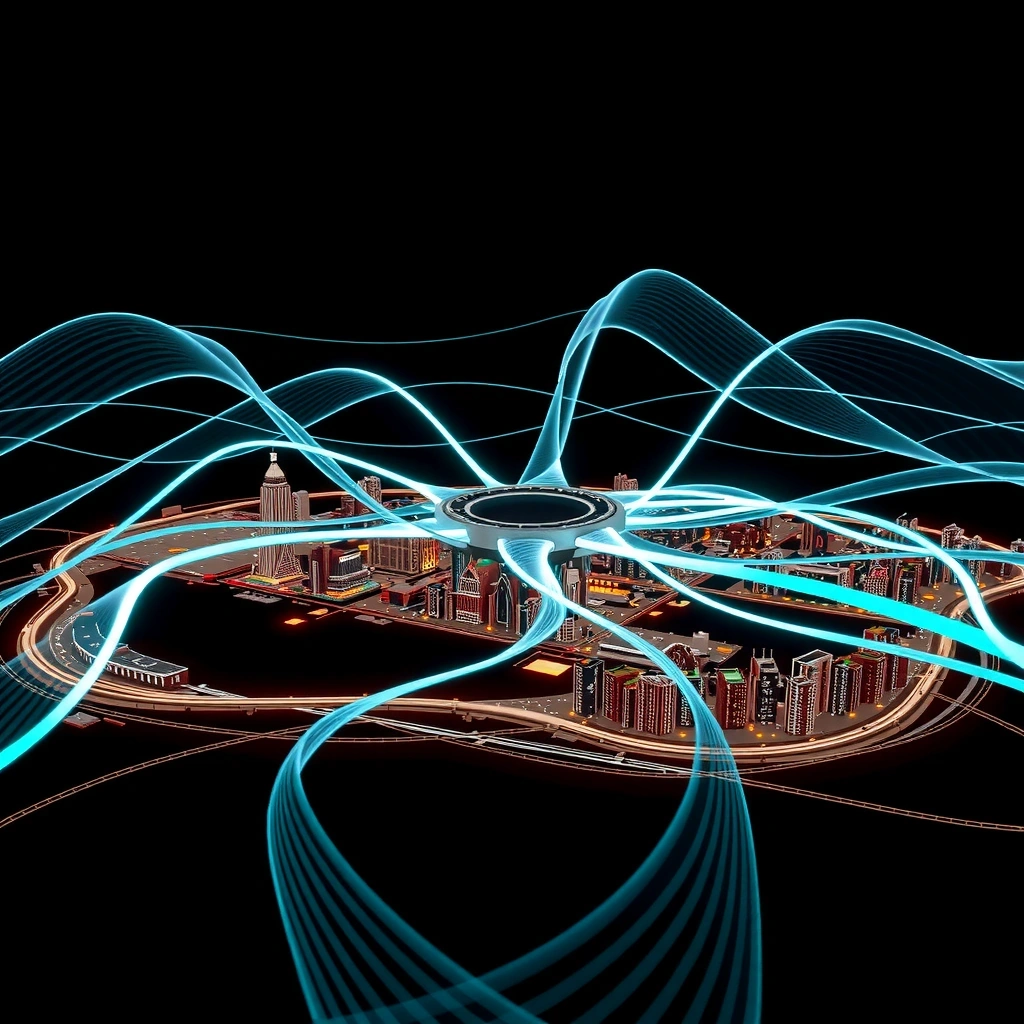
Visualize the Pulse of Qatar's 5G Network.
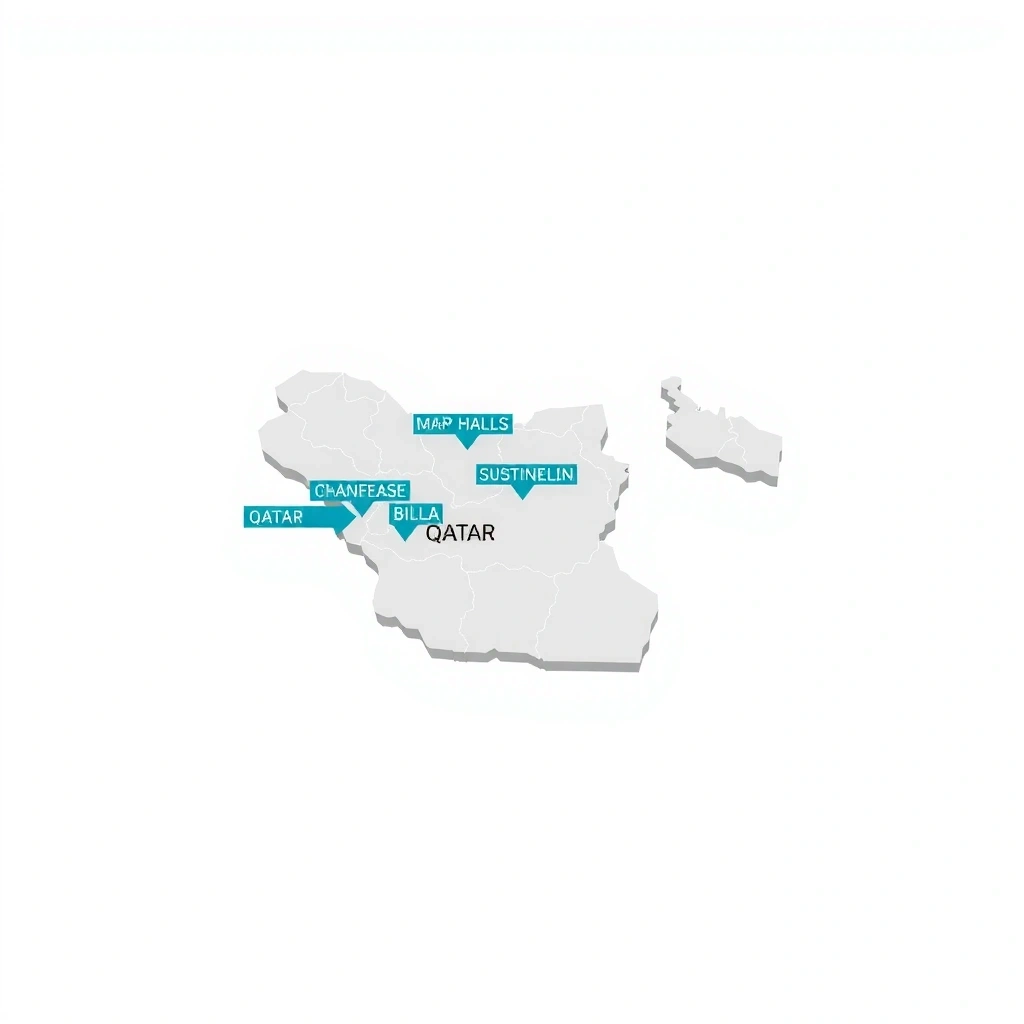
Explore an interactive intelligence layer over Qatar's geography. See where signal density peaks, how the grid supports major infrastructure, and what coverage looks like in your specific district. This is not just a map; it is a live blueprint of connectivity.

Coverage Intelligence
Select a region to view signal strength architecture.
The Network
By The Numbers
Qatar's 5G infrastructure is engineered for high-density environments and extreme low latency. These metrics reflect the peak performance recorded across the national grid in Q4 2025.
"The challenge wasn't just coverage; it was consistency across vertical density. The current grid resolves this with spatial multiplexing."
Dr. Al-Mansoori, Network ArchitectVertical vs. Horizontal Coverage
Qatar's architecture faces unique challenges: low-lying residential areas and high-density skyscrapers in West Bay. Our map accounts for elevation.
-
Ground Level Line-of-sight optimal, 360° antenna spread.
-
High Rise DAS (Distributed Antenna Systems) for indoor penetration.

Coverage Where It Matters
We map the network not just by geography, but by density of use. Here is how the grid performs during peak demand.

8K Streaming
Residential zones maintain >800Mbps average speeds, supporting simultaneous 8K streams and gaming without packet loss.

Cloud Sync
West Bay nodes prioritize uplink bandwidth. Large file transfers to cloud servers complete 4x faster than legacy 4G LTE.
Live Biometrics
High-density crowd management ensures smartwatch and IoT devices stay connected, even during Friday peak hours.
Experiencing a dead zone?
Help us improve the grid. Submit a report with your location, and our engineering team analyzes every report for network optimization.